BI | Business Intelligence & Controlling
The built-in Business Intelligence module in C3 facilitates your cross-divisional reporting of company data as a powerful tool for both users and management for the automated creation of the widest range of queries, statistics and reports. Offering added transparency and information, which significantly supports your decision making and gives you the key data you need to ensure you have the best arguments to hand. Regardless of whether it concerns the efficiency of specific product groups or customers or complaints related to specific production methods, C3 provides you with a solid number base at all times as well as performance indicators for commercial performance monitoring and forward looking decisions.
Your key advantages at a glance
- Practice-oriented analytical templates for a quick-start in reporting
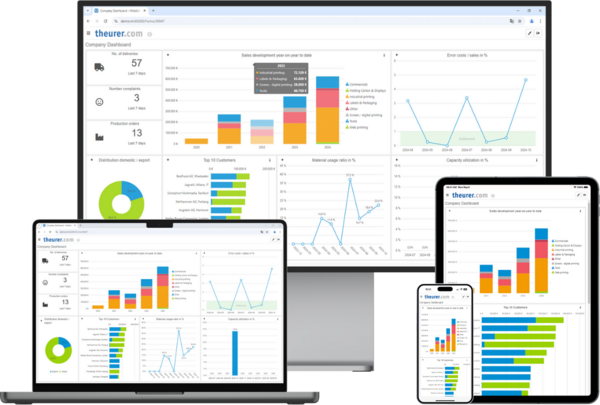
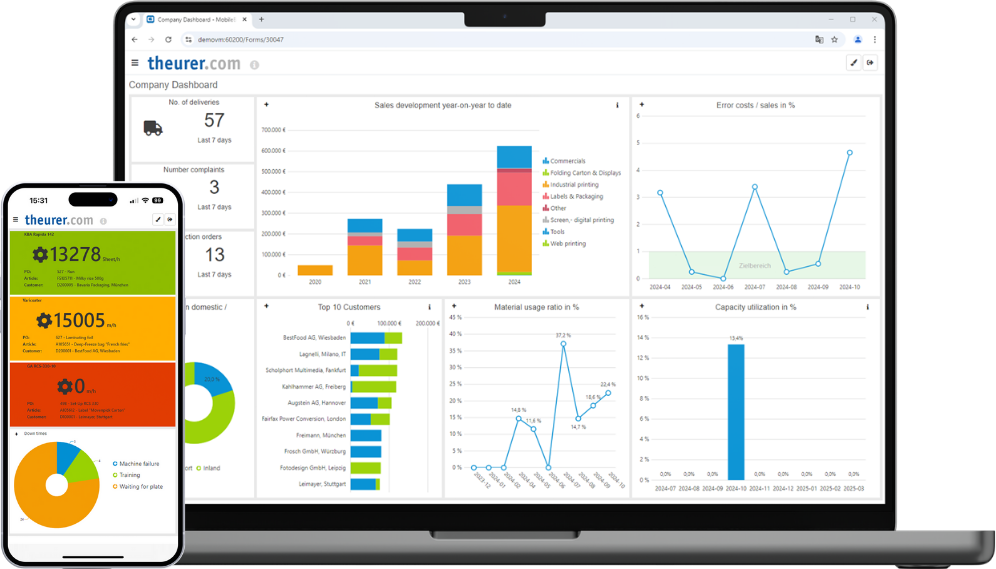
- Dashboards which function as a management cockpit show all relevant data at once
- Designed like MS Excel user interfaces and graphs for optimal comfort
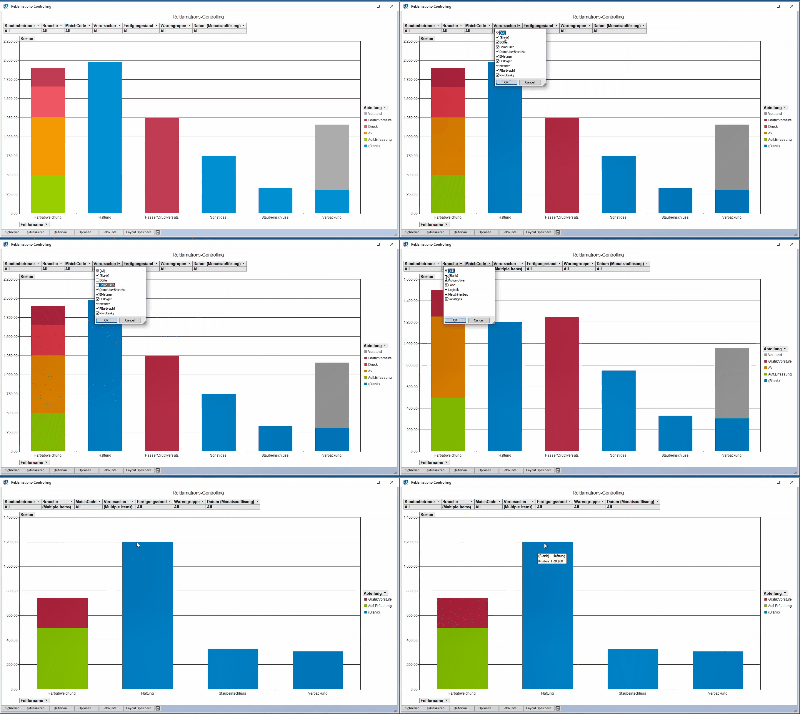
- Filter pivot tables/diagrams interactively until you find the desired data base
- The workflow lists provide you a constant view of actual tasks in your area
The dashboards bring together all of the important figures and information in a management cockpit in real time. Dashboards can be tailored to specific roles, and they can display metrics that have been geared toward a particular aspect or department. With just one click on the dashboard, different interest groups, such as sales, production, or controlling, receive the information that is relevant to them, always up to date. One example for the use of the dashboard is a production cockpit that shows production output, on-time performance, costs of errors, and capacity at a glance, with all of this information always up to date. The dashboard visualizes the key results in clear and well-organized graphics, making it easy for users to monitor results.
OLAP-Cubes and individual evaluations
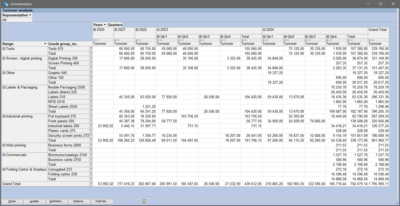
The C3 Pivot analysis, so-called OLAP-Cubes, offer the possibility of collecting the data material necessary for solid decision making. The data is organized and condensed multi-dimensionally following your input, permitting far-reaching sales or ordering analyses. With each use, you are able to add more and more details, filtering and displaying as needed. Even complex analyses, like the revenue comparison of 2 sales people in the fourth quarter of the last five years, are easily reportable without previous knowledge.
All evaluations can, as required, be shown in three different versions – in list form, as a diagram or as an interactive table. Each evaluation can be printed as a report, sent by e-mail or even exported with one click to Microsoft Excel or Word for further processing and you have numerous useful statistics and evaluations for immediate use. Companywide automated reporting could not be easier for all users.
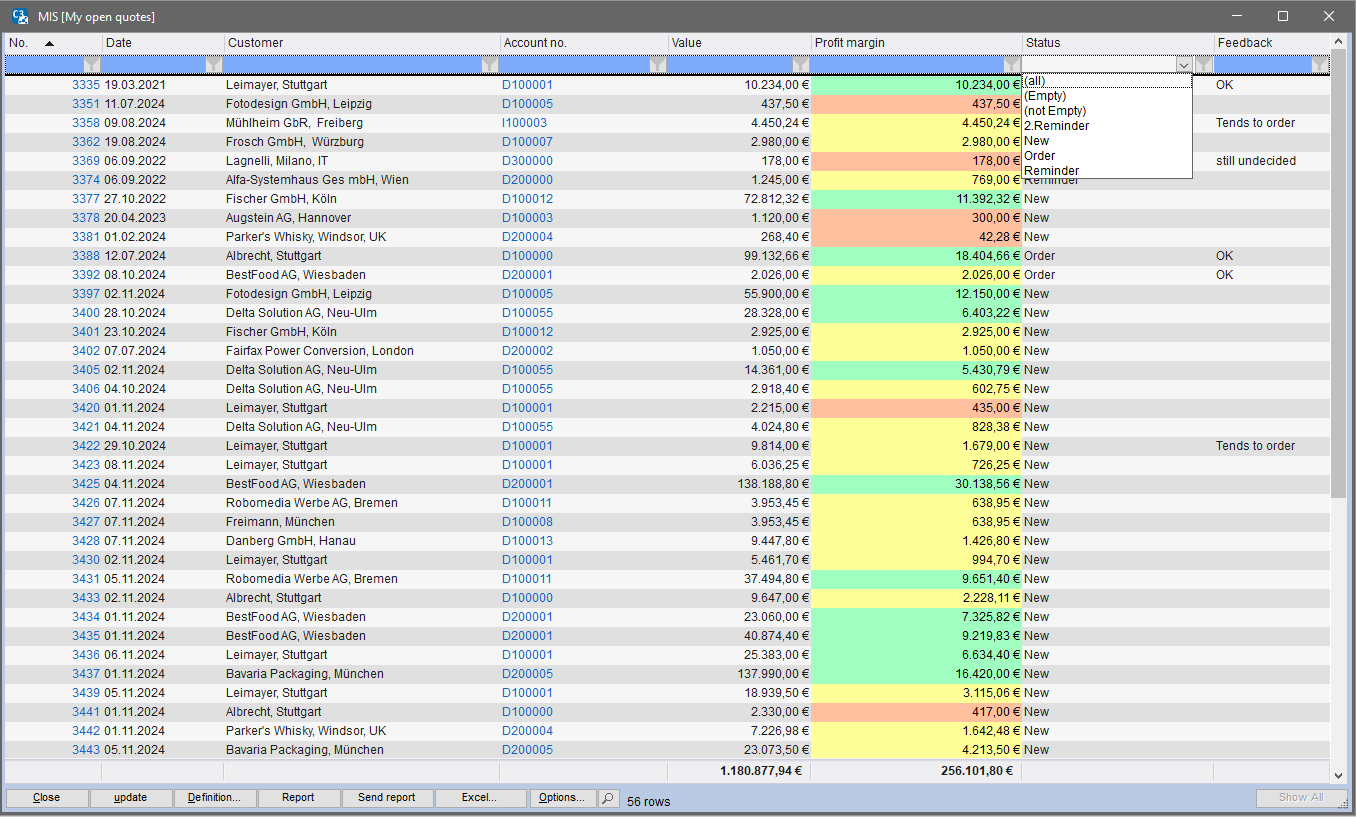
Individual analysis and reports with one's own data can be created extremely fast and comfortably with the help of integrated assistants. A magnifying glass function can also be defined for some countries. With this tool a magnifying glass is shown in the appropriate field, executing a definable action. In this example the customer/interested party is opened with a click on the magnifying glass. Through this additional functionality can be installed for improved workflow of the MIS Viewer. A view can defined, in which one can jump with the magnifying glass directly to the respective quotation to "my open offers" for a sales employee.
If you plan your own analyses, numerous predefined functions are available as well as statistical views specially tailored to your own needs. The definition of an analysis in this case always consists of an SQL definition, while the definition of graphical preparation may take the form of a list, an interactive diagram or an interactive pivot table. SQL definitions can also be created with a built-in graphical enquiry designer. The complete definition of an analysis can be exported and imported as an XML file, allowing even complex analyses to be easily exchanged between your installation and the theurer.com customizing team.
